
概述
Elasticsearch安装
ES部署(无需安装);
零配置,开销即用;
没有繁琐的安装配置。
下载安装
wget https://artifacts.elastic.co/downloads/elasticsearch/elasticsearch-7.16.2-darwin-x86_64.tar.gz
wget https://artifacts.elastic.co/downloads/elasticsearch/elasticsearch-7.16.2-darwin-x86_64.tar.gz.sha512
shasum -a 512 -c elasticsearch-7.16.2-darwin-x86_64.tar.gz.sha512
tar -xzf elasticsearch-7.16.2-darwin-x86_64.tar.gz
cd elasticsearch-7.16.2/
启动
/usr/local/elasticsearch-7.16.2/bin/elasticsearch -d(后台运行)
安装错误解决方案
Elasticsearch安装启动问题总结-Elasticsearch
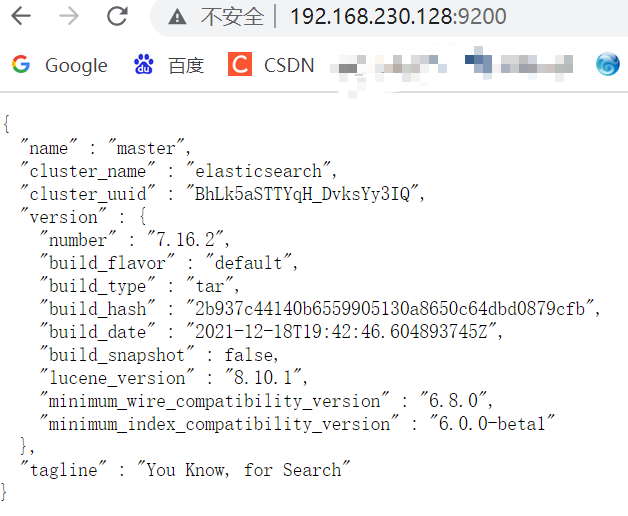
测试
Kibana
Kibana简介
Kibana是一个针对Elasticsearch的开源分析及可视化平台,用来搜索、查看交互存储在Elasticsearch索引中的数据。
官方地址:https://www.elastic.co/cn/products/kibana
下载安装
参考官网:官网安装
cd /usr/local
curl -O https://artifacts.elastic.co/downloads/kibana/kibana-7.16.2-linux-x86_64.tar.gz
curl https://artifacts.elastic.co/downloads/kibana/kibana-7.16.2-linux-x86_64.tar.gz.sha512 | shasum -a 512 -c -
tar -xzf kibana-7.16.2-linux-x86_64.tar.gz
cd kibana-7.16.2-linux-x86_64/
配置
Kibana 配置详解
Kibana 安装及配置
到kibana安装目录的config下,编辑kibana.yml配置文件,添加如下配置:
#配置本机ip
server.host: "192.168.230.128"
#配置es集群url
elasticsearch.url: "http://192.168.230.128:9200"
或者使用elasticsearch.host:["http://192.168.230.128:9200"]
启动
nohup ./kibana &
或者
nohup ./kibana >/dev/null 2>&1 &
成功启动后,可以访问:http://ip:5601来访问kibana,ip为kibana安装节点ip,端口默认为5601,可以在config/kibana.yml中配置。
启动错误注意事项
需要像安装elastic那样,在非root账号下启动,同时设置文件夹读写权限,设置chown的把文件读写权限改变到kibana的起动账号,参考elastic错误总结中非root权限安装的问题即可。
Logstash
安装
可以到Logstash官方网站下载安装包,选择对应的版本。
https://www.elastic.co/cn/downloads/past-releases/logstash-7-16-2
或者直接在linux系统中下载
[root@master local]# cd /usr/local
[root@master local]# curl -O https://artifacts.elastic.co/downloads/logstash/logstash-7.16.2-linux-x86_64.tar.gz
[root@master local]# tar -xzf logstash-7.16.2-linux-x86_64.tar.gz
启动
[root@master local]# /usr/local/logstash-7.16.2/bin
[root@master bin]# ./logstash -e "input {stdin{}} output {stdout{}}"
启动完成后,在屏幕上输入hello,会有相应的输出。
输出结果:
[2022-05-04T16:45:10,924][INFO ][logstash.runner          ] Log4j configuration path used is: /usr/local/logstash-7.16.2/config/log4j2.properties
[2022-05-04T16:45:10,954][INFO ][logstash.runner          ] Starting Logstash {"logstash.version"=>"7.16.2", "jruby.version"=>"jruby 9.2.20.1 (2.5.8) 2021-11-30 2a2962fbd1 Java HotSpot(TM) 64-Bit Server VM 25.291-b10 on 1.8.0_291-b10 +indy +jit [linux-x86_64]"}
[2022-05-04T16:45:11,022][INFO ][logstash.settings        ] Creating directory {:setting=>"path.queue", :path=>"/usr/local/logstash-7.16.2/data/queue"}
[2022-05-04T16:45:11,045][INFO ][logstash.settings        ] Creating directory {:setting=>"path.dead_letter_queue", :path=>"/usr/local/logstash-7.16.2/data/dead_letter_queue"}
[2022-05-04T16:45:11,549][WARN ][logstash.config.source.multilocal] Ignoring the 'pipelines.yml' file because modules or command line options are specified
[2022-05-04T16:45:11,604][INFO ][logstash.agent           ] No persistent UUID file found. Generating new UUID {:uuid=>"c0c37eeb-06ef-42ac-9ce5-6a9d0ebd4939", :path=>"/usr/local/logstash-7.16.2/data/uuid"}
[2022-05-04T16:45:14,346][INFO ][logstash.agent           ] Successfully started Logstash API endpoint {:port=>9600, :ssl_enabled=>false}
[2022-05-04T16:45:15,263][INFO ][org.reflections.Reflections] Reflections took 97 ms to scan 1 urls, producing 119 keys and 417 values
[2022-05-04T16:45:17,547][INFO ][logstash.javapipeline    ][main] Starting pipeline {:pipeline_id=>"main", "pipeline.workers"=>2, "pipeline.batch.size"=>125, "pipeline.batch.delay"=>50, "pipeline.max_inflight"=>250, "pipeline.sources"=>["config string"], :thread=>"#<Thread:0x658562b0 run>"}
[2022-05-04T16:45:19,045][INFO ][logstash.javapipeline    ][main] Pipeline Java execution initialization time {"seconds"=>1.49}
[2022-05-04T16:45:19,239][INFO ][logstash.javapipeline    ][main] Pipeline started {"pipeline.id"=>"main"}
The stdin plugin is now waiting for input:
[2022-05-04T16:45:19,439][INFO ][logstash.agent           ] Pipelines running {:count=>1, :running_pipelines=>[:main], :non_running_pipelines=>[]}
{
      "@version" => "1",
    "@timestamp" => 2022-05-04T08:45:19.461Z,
          "host" => "master",
       "message" => ""
}
{
      "@version" => "1",
    "@timestamp" => 2022-05-04T08:45:19.490Z,
          "host" => "master",
       "message" => ""
}
hello
{
      "@version" => "1",
    "@timestamp" => 2022-05-04T08:45:24.052Z,
          "host" => "master",
       "message" => "hello"
}
如下想终止Logstash,只要在命令行输入“Ctrl+C”即可。
启动命令简介
如果在命令行启动日志中看到“Successfully started Logstash API endpoint {:port=>9600}”,就证明启动成功了。
上面启动命令中,-e代表输入配置字符串定义了标准输入插件(即stdin)和一个标准输出插件(即stdout),意思就是从命令行提取输入,并在命令行直接将提取的数据输出。如果想要更换输入或输出,只要将input或output中的插件名称更换即可,这充分体现了Logstash管道配置的灵活性。
默认情况下,stdout输出插件的编解码器为rubydebug,所以输出内容包含了版本、时间等信息,其中message属性包含的就是在命令行输入的内容。试着将输出插件的编码器更换为plain或line,则输入的结果将会发生变化。
[root@master bin]# ./logstash -e "input {stdin{}} output {stdout{codec=>plain}}"
输入:Hello,World!
输出:
2022-05-04T09:03:07.723Z master Hello,World!
参考
版权声明:本文内容由互联网用户自发贡献,该文观点仅代表作者本人。本站仅提供信息存储空间服务,不拥有所有权,不承担相关法律责任。如发现本站有涉嫌侵权/违法违规的内容, 请发送邮件至 举报,一经查实,本站将立刻删除。
文章由极客之音整理,本文链接:https://www.bmabk.com/index.php/post/100185.html

