
ECharts是百度团队制作的,一个使用 JavaScript 实现的开源可视化库,可以流畅的运行在 PC 和移动设备上,兼容当前绝大部分浏览器(IE8/9/10/11,Chrome,Firefox,Safari等),底层依赖矢量图形库 ZRender,提供直观,交互丰富,可高度个性化定制的数据可视化图表。
ECharts官网实例
以下效果使用的静态数据 ,如需动态,自行依需修改即可。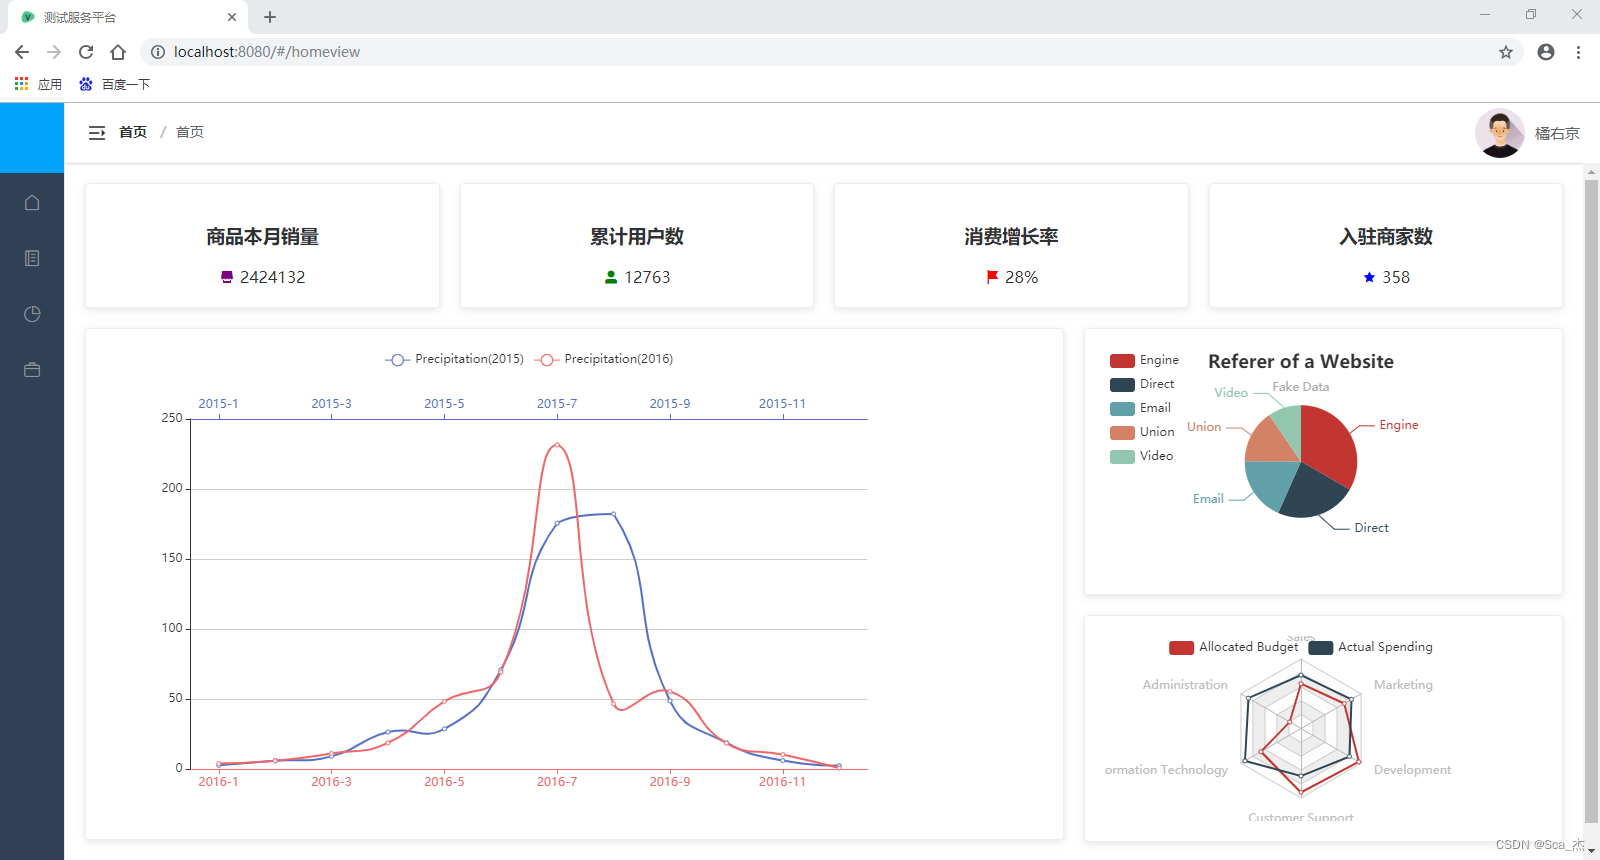

步骤
第一步,在引入依赖的时候,需要选择旧版本,因为从2022年开始 默认的5.0以上版本会出现渲染问题。
npm install echarts@4.9.0 --save第二步,如需全局导入,在main.js中添加如下(建议的是不要全局导入,按需来)
import Vue from 'vue'
import echarts from 'echarts'
//需要挂载到Vue原型上
Vue.prototype.$echarts = echarts
第三步,分别配置3个ECharts的vue子组件,分别代码如下(可直接复制粘贴使用):
1、折线图=>@/ECharts/echarts1.vue/
<template>
  <div style="width: auto;height: 470px" id="echarts1">
  </div>
</template>

<script>
import echarts from 'echarts'
const colors = ['#5470C6', '#EE6666']
export default {
  name: 'echarts1',
  data () {
    return {
      // option配置
      option: {
        color: colors,
        tooltip: {
          trigger: 'none',
          axisPointer: {
            type: 'cross'
          }
        },
        legend: {},
        grid: {
          top: 70,
          bottom: 50
        },
        xAxis: [
          {
            type: 'category',
            axisTick: {
              alignWithLabel: true
            },
            axisLine: {
              onZero: false,
              lineStyle: {
                color: colors[1]
              }
            },
            axisPointer: {
              label: {
                formatter: function (params) {
                  return (
                    'Precipitation  ' +
                    params.value +
                    (params.seriesData.length ? ':' + params.seriesData[0].data : '')
                  )
                }
              }
            },
            // prettier-ignore
            data: ['2016-1', '2016-2', '2016-3', '2016-4', '2016-5', '2016-6', '2016-7', '2016-8', '2016-9', '2016-10', '2016-11', '2016-12']
          },
          {
            type: 'category',
            axisTick: {
              alignWithLabel: true
            },
            axisLine: {
              onZero: false,
              lineStyle: {
                color: colors[0]
              }
            },
            axisPointer: {
              label: {
                formatter: function (params) {
                  return (
                    'Precipitation  ' +
                    params.value +
                    (params.seriesData.length ? ':' + params.seriesData[0].data : '')
                  )
                }
              }
            },
            // prettier-ignore
            data: ['2015-1', '2015-2', '2015-3', '2015-4', '2015-5', '2015-6', '2015-7', '2015-8', '2015-9', '2015-10', '2015-11', '2015-12']
          }
        ],
        yAxis: [
          {
            type: 'value'
          }
        ],
        series: [
          {
            name: 'Precipitation(2015)',
            type: 'line',
            xAxisIndex: 1,
            smooth: true,
            emphasis: {
              focus: 'series'
            },
            data: [
              2.6, 5.9, 9.0, 26.4, 28.7, 70.7, 175.6, 182.2, 48.7, 18.8, 6.0, 2.3
            ]
          },
          {
            name: 'Precipitation(2016)',
            type: 'line',
            smooth: true,
            emphasis: {
              focus: 'series'
            },
            data: [
              3.9, 5.9, 11.1, 18.7, 48.3, 69.2, 231.6, 46.6, 55.4, 18.4, 10.3, 0.7
            ]
          }
        ]
      }
    }
  },
  mounted () {
    this.echartsInit()
  },
  methods: {
    echartsInit () {
      // 在生命周期中挂载
      echarts.init(document.getElementById('echarts1')).setOption(this.option)
    }
  }
}
</script>

<style scoped>

</style>2、饼状图=>@/ECharts/echarts2.vue/
<template>
  <div style="width: auto;height: 225px" id="echarts2">
  </div>
</template>

<script>
import echarts from 'echarts'
export default {
  name: 'echarts2',
  data () {
    return {
      // option配置
      option: {
        title: {
          text: 'Referer of a Website',
          subtext: 'Fake Data',
          left: 'center'
        },
        tooltip: {
          trigger: 'item'
        },
        legend: {
          orient: 'vertical',
          left: 'left'
        },
        series: [
          {
            name: 'Access From',
            type: 'pie',
            radius: '50%',
            data: [
              { value: 1048, name: 'Engine' },
              { value: 735, name: 'Direct' },
              { value: 580, name: 'Email' },
              { value: 484, name: 'Union' },
              { value: 300, name: 'Video' }
            ],
            emphasis: {
              itemStyle: {
                shadowBlur: 10,
                shadowOffsetX: 0,
                shadowColor: 'rgba(0, 0, 0, 0.5)'
              }
            }
          }
        ]
      }
    }
  },
  mounted () {
    this.echartsInit()
  },
  methods: {
    echartsInit () {
      // 在生命周期中挂载
      echarts.init(document.getElementById('echarts2')).setOption(this.option)
    }
  }
}
</script>

<style scoped>

</style>
3、正六边形图=>@/ECharts/echarts3.vue/
<template>
  <div style="width: auto;height: 185px" id="echarts3">
  </div>
</template>

<script>
import echarts from 'echarts'
export default {
  name: 'echarts3',
  data () {
    return {
      // option配置
      option: {
        legend: {
          data: ['Allocated Budget', 'Actual Spending']
        },
        radar: {
          // shape: 'circle',
          indicator: [
            { name: 'Sales', max: 6500 },
            { name: 'Administration', max: 16000 },
            { name: 'Information Technology', max: 30000 },
            { name: 'Customer Support', max: 38000 },
            { name: 'Development', max: 52000 },
            { name: 'Marketing', max: 25000 }
          ]
        },
        series: [
          {
            name: 'Budget vs spending',
            type: 'radar',
            data: [
              {
                value: [4200, 3000, 20000, 35000, 50000, 18000],
                name: 'Allocated Budget'
              },
              {
                value: [5000, 14000, 28000, 26000, 42000, 21000],
                name: 'Actual Spending'
              }
            ]
          }
        ]
      }
    }
  },
  mounted () {
    this.echartsInit()
  },
  methods: {
    echartsInit () {
      // 在生命周期中挂载
      echarts.init(document.getElementById('echarts3')).setOption(this.option)
    }
  }
}
</script>

<style scoped>

</style>
第四步,配置统计页面home.vue(@/Home/home.vue/),引入3个ECharts子组件,就完成了。
代码如下(可直接复制粘贴):
<template>
  <div>
    <!--块类统计-->
    <el-row :gutter="20">
      <el-col :span="6">
        <el-card class="box-card">
          <h3>商品本月销量</h3>
          <div>
            <i class="el-icon-s-shop" style="color: purple"></i>
            <span>2424132</span>
          </div>
        </el-card>
      </el-col>
      <el-col :span="6">
        <el-card class="box-card">
          <h3>累计用户数</h3>
          <div>
            <i class="el-icon-user-solid" style="color: green"></i>
            <span>12763</span>
          </div>
        </el-card>
      </el-col>
      <el-col :span="6">
        <el-card class="box-card">
          <h3>消费增长率</h3>
          <div>
            <i class="el-icon-s-flag" style="color: red"></i>
            <span>28%</span>
          </div>
        </el-card>
      </el-col>
      <el-col :span="6">
        <el-card class="box-card">
          <h3>入驻商家数</h3>
          <div>
            <i class="el-icon-star-on" style="color: blue"></i>
            <span>358</span>
          </div>
        </el-card>
      </el-col>
    </el-row>
    <!--acharts统计图-->
    <el-row :gutter="20">
      <el-col :span="16">
        <el-card class="box-card">
          <echarts1 />
        </el-card>
      </el-col>
      <el-col :span="8">
        <el-card class="box-card">
          <echarts2 />
        </el-card>
        <el-card class="box-card">
          <echarts3 />
        </el-card>
      </el-col>
    </el-row>
  </div>
</template>

<script>
import echarts1 from './ECharts/echarts1'
import echarts2 from './ECharts/echarts2'
import echarts3 from './ECharts/echarts3'

export default {
  name: 'home',
  components: {
    echarts1,
    echarts2,
    echarts3
  }
}
</script>

<style scoped>
.el-card{
  margin-bottom: 20px;
  text-align: center;
}

</style>
版权声明:本文内容由互联网用户自发贡献,该文观点仅代表作者本人。本站仅提供信息存储空间服务,不拥有所有权,不承担相关法律责任。如发现本站有涉嫌侵权/违法违规的内容, 请发送邮件至 举报,一经查实,本站将立刻删除。
文章由极客之音整理,本文链接:https://www.bmabk.com/index.php/post/106469.html

