
背景
大数据的展示,Chart图表的方式一目了然。
用法
目标:可显示实现列表对象数据,可切换不同列表显示
1.Nuget程序包安装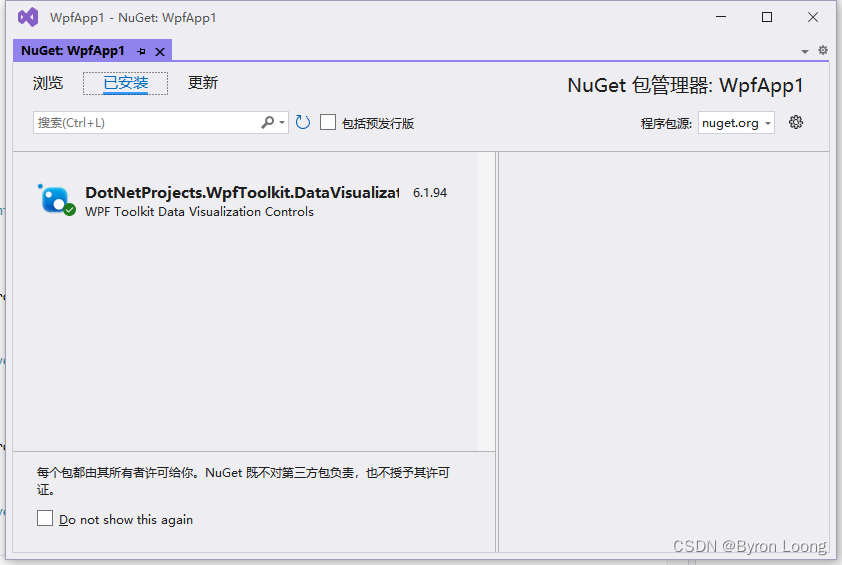

2.界面构建
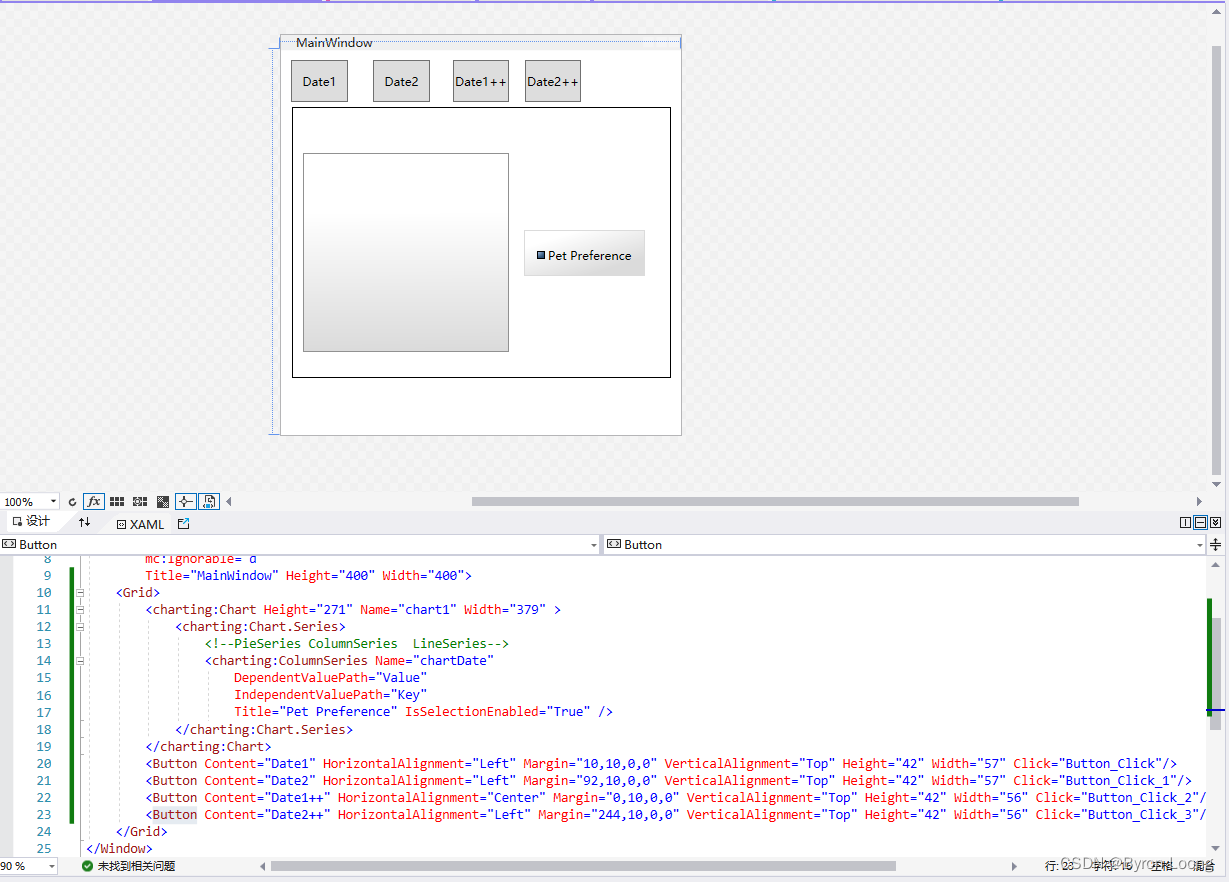
<Window x:Class="WpfApp1.MainWindow"
xmlns="http://schemas.microsoft.com/winfx/2006/xaml/presentation"
xmlns:x="http://schemas.microsoft.com/winfx/2006/xaml"
xmlns:d="http://schemas.microsoft.com/expression/blend/2008"
xmlns:mc="http://schemas.openxmlformats.org/markup-compatibility/2006"
xmlns:local="clr-namespace:WpfApp1"
xmlns:charting="clr-namespace:System.Windows.Controls.DataVisualization.Charting;assembly=DotNetProjects.DataVisualization.Toolkit"
mc:Ignorable="d"
Title="MainWindow" Height="400" Width="400">
<Grid>
<charting:Chart Height="271" Name="chart1" Width="379" >
<charting:Chart.Series>
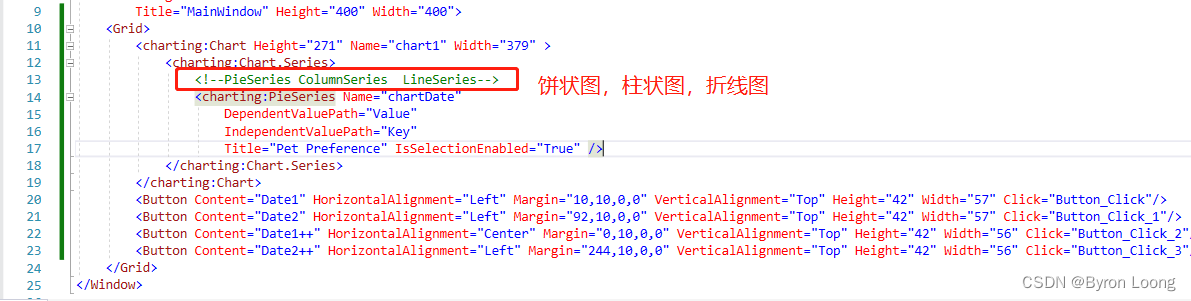
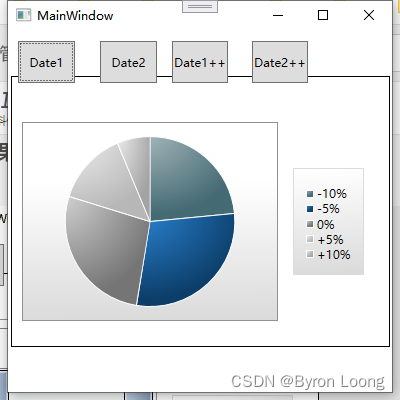
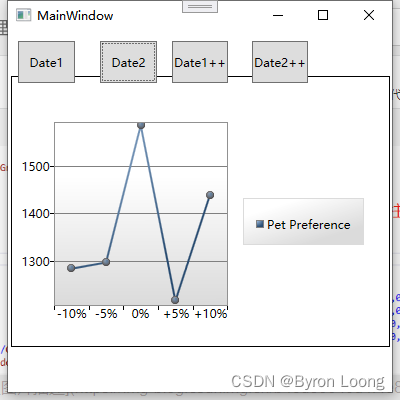
<!--PieSeries ColumnSeries LineSeries-->
<charting:ColumnSeries Name="chartDate"
DependentValuePath="Value"
IndependentValuePath="Key"
Title="Pet Preference" IsSelectionEnabled="True" />
</charting:Chart.Series>
</charting:Chart>
<Button Content="Date1" HorizontalAlignment="Left" Margin="10,10,0,0" VerticalAlignment="Top" Height="42" Width="57" Click="Button_Click"/>
<Button Content="Date2" HorizontalAlignment="Left" Margin="92,10,0,0" VerticalAlignment="Top" Height="42" Width="57" Click="Button_Click_1"/>
<Button Content="Date1++" HorizontalAlignment="Center" Margin="0,10,0,0" VerticalAlignment="Top" Height="42" Width="56" Click="Button_Click_2"/>
<Button Content="Date2++" HorizontalAlignment="Left" Margin="244,10,0,0" VerticalAlignment="Top" Height="42" Width="56" Click="Button_Click_3"/>
</Grid>
</Window>
3.后台
数据对象构建
public class Map : INotifyPropertyChanged
    {
        public Map()
        {

        }

        public Map(string key, int value)
        {
            this.key = key;
            this.value = value;
        }

        private string key = "";
        private int value = 0;

        public string Key
        {
            get => key;
            set
            {
                key = value;
                RaisePropertyChanged("Key");
            }
        }
        public int Value
        {
            get => value;
            set
            {
                this.value = value;
                RaisePropertyChanged("Value");
            }
        }

        #region Methods
        public event PropertyChangedEventHandler PropertyChanged;
        private void RaisePropertyChanged(string propertyName)
        {
            PropertyChangedEventHandler handler = PropertyChanged;
            if (handler != null)
            {
                handler(this, new PropertyChangedEventArgs(propertyName));
            }
        }
        #endregion
    }
    public class ViewModel
    {
        public ObservableCollection<Map> Pair1 { get; set; }
        public ObservableCollection<Map> Pair2 { get; set; }

        public ViewModel()
        {
            Pair1 = new ObservableCollection<Map>();
            Pair1.Add(new Map("-10%", 40));
            Pair1.Add(new Map("-5%", 50));
            Pair1.Add(new Map("0%", 100));
            Pair1.Add(new Map("+5%", 55));
            Pair1.Add(new Map("+10%", 2));

            Pair2 = new ObservableCollection<Map>();
            Pair2.Add(new Map("-10%", 40));
            Pair2.Add(new Map("-5%", 50));
            Pair2.Add(new Map("0%", 100));
            Pair2.Add(new Map("+5%", 55));
            Pair2.Add(new Map("+10%", 2));
        }
    }
4.对象绑定
/// <summary>
    /// Interaction logic for MainWindow.xaml
    /// </summary>
    public partial class MainWindow : Window
    {
        ViewModel viewModel = new ViewModel();
        Random random = new Random();
        public MainWindow()
        {
            InitializeComponent();
            chart1.DataContext = new ViewModel();
        }

        private void Button_Click(object sender, RoutedEventArgs e)
        {
            Binding b2 = new Binding();
            b2.Source = viewModel;
            b2.Path = new PropertyPath("Pair2");
            chartDate.SetBinding(ColumnSeries.ItemsSourceProperty, b2);
        }

        private void Button_Click_1(object sender, RoutedEventArgs e)
        {
            Binding b1 = new Binding();
            b1.Source = viewModel;
            b1.Path = new PropertyPath("Pair1");
            chartDate.SetBinding(ColumnSeries.ItemsSourceProperty, b1);
        }

        private void Button_Click_2(object sender, RoutedEventArgs e)
        {
            foreach (var item in viewModel.Pair1)
            {
                int i = random.Next(0, 100);
                item.Value += i;
            }
        }

        private void Button_Click_3(object sender, RoutedEventArgs e)
        {
            foreach (var item in viewModel.Pair2)
            {
                int i = random.Next(0, 100);
                item.Value += i;
            }
        }
    }
效果展示
不同形式
觉得有用就请关注赞收藏吧!!!
工控之路,不迷茫
版权声明:本文内容由互联网用户自发贡献,该文观点仅代表作者本人。本站仅提供信息存储空间服务,不拥有所有权,不承担相关法律责任。如发现本站有涉嫌侵权/违法违规的内容, 请发送邮件至 举报,一经查实,本站将立刻删除。
文章由极客之音整理,本文链接:https://www.bmabk.com/index.php/post/51761.html

