
效果:
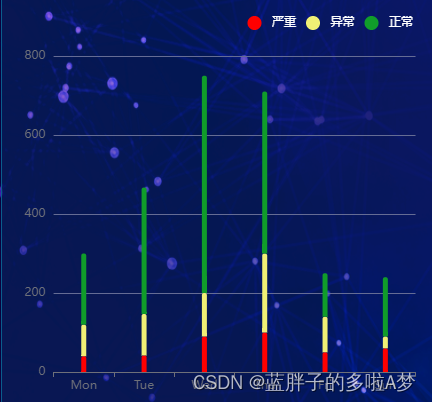
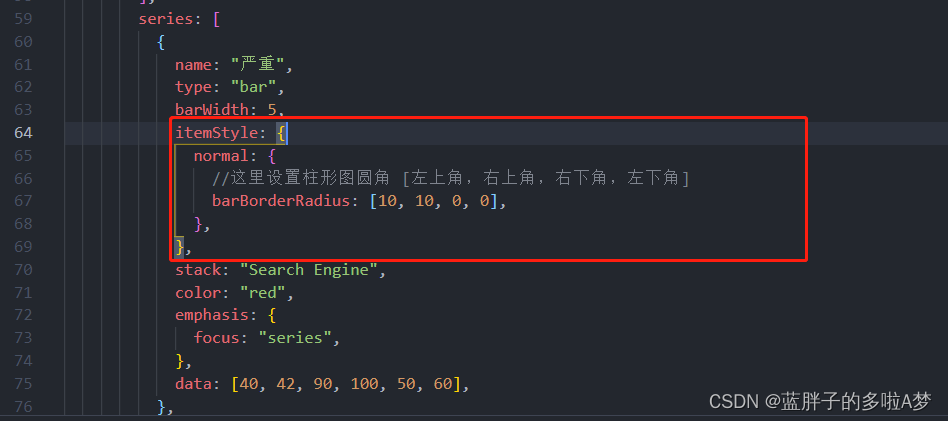
设置圆角:
圆角:
borderWidth:宽度
itemStyle: {
              normal: {
                //这里设置柱形图圆角 [左上角,右上角,右下角,左下角]
                barBorderRadius: [10, 10, 0, 0],
              },
            },
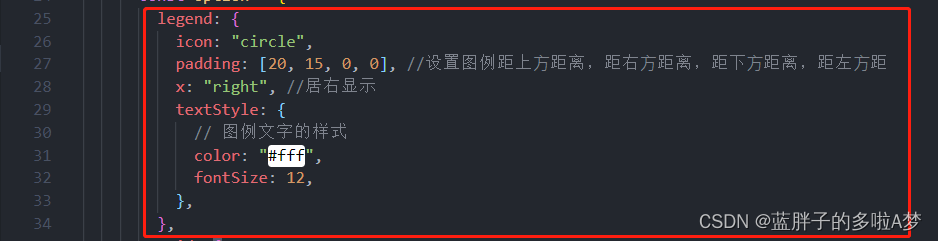
图例形状圆形:
icon: “circle”, // 这个字段控制形状 类型包括 circle 圆形,triangle 三角形,diamond 四边形,arrow 变异三角形,none 无
legend: {
          icon: "circle",
          padding: [20, 15, 0, 0], //设置图例距上⽅距离,距右⽅距离,距下⽅距离,距左⽅距
          x: "right", //居右显示
          textStyle: {
            // 图例文字的样式
            color: "#fff",
            fontSize: 12,
          },
        },
完整代码:
<template>
  <div
    class="echart"
    id="myBarchart"
    :style="{
      bottom: '0px',
      width: '100%',
      height: '400px',
    }"
  ></div>
</template>
<script>
import * as echarts from "echarts";
export default {
  name: "lineChart",
  data() {
    return {};
  },
  mounted() {
    this.initEcharts();
  },
  methods: {
    initEcharts() {
      const option = {
        legend: {
          icon: "circle",
          padding: [20, 15, 0, 0], //设置图例距上⽅距离,距右⽅距离,距下⽅距离,距左⽅距
          x: "right", //居右显示
          textStyle: {
            // 图例文字的样式
            color: "#fff",
            fontSize: 12,
          },
        },
        grid: {
          left: "3%",
          right: "3%",
          bottom: "0.1%",
          containLabel: true,
        },
        xAxis: [
          {
            type: "category",
            data: ["Mon", "Tue", "Wed", "Thu", "Fri", "Sun"],
          },
        ],
        yAxis: [
          {
            type: "value",
            splitLine: {
              show: true,
              lineStyle: {
                type: "solid",
                color: "#656c94",
              },
            },
          },
        ],
        series: [
          {
            name: "严重",
            type: "bar",
            barWidth: 5,
            itemStyle: {
              normal: {
                //这里设置柱形图圆角 [左上角,右上角,右下角,左下角]
                barBorderRadius: [10, 10, 0, 0],
              },
            },
            stack: "Search Engine",
            color: "red",
            emphasis: {
              focus: "series",
            },
            data: [40, 42, 90, 100, 50, 60],
          },
          {
            name: "异常",
            type: "bar",
            stack: "Search Engine",
            itemStyle: {
              normal: {
                //这里设置柱形图圆角 [左上角,右上角,右下角,左下角]
                barBorderRadius: [10, 10, 0, 0],
              },
            },
            color: "#f0f075",
            emphasis: {
              focus: "series",
            },
            data: [80, 105, 110, 200, 90, 30],
          },
          {
            name: "正常",
            type: "bar",
            itemStyle: {
              normal: {
                //这里设置柱形图圆角 [左上角,右上角,右下角,左下角]
                barBorderRadius: [10, 10, 0, 0],
              },
            },
            stack: "Search Engine",
            color: "#109d2a",
            emphasis: {
              focus: "series",
            },
            data: [180, 320, 550, 410, 110, 150],
          },
        ],
      };
      const myChart = echarts.init(document.getElementById("myBarchart")); // 图标初始化
      myChart.setOption(option); // 渲染页面
      //随着屏幕大小调节图表
      window.addEventListener("resize", () => {
        myChart.resize();
      });
    },
  },
};
</script>
<style scoped>
</style>
版权声明:本文内容由互联网用户自发贡献,该文观点仅代表作者本人。本站仅提供信息存储空间服务,不拥有所有权,不承担相关法律责任。如发现本站有涉嫌侵权/违法违规的内容, 请发送邮件至 举报,一经查实,本站将立刻删除。
文章由极客之音整理,本文链接:https://www.bmabk.com/index.php/post/79252.html

