
场景
Turf.js
Advanced geospatial analysis for browsers and Node.js
浏览器和Node.js的高级地理空间分析。
特点
Modular, simple-to-understand JavaScript functions that speak GeoJSON
模块化、简单易懂的JavaScript函数使用GeoJSON
Turf is a collection of small modules, you only need to take what you want to use
Turf是小模块的集合,你只需要拿你想用的
Takes advantage of the newest algorithms and doesn’t require you to send data to a server
利用最新算法,不需要您将数据发送到服务器
官网:
Turf.js | Advanced Geospatial Analysis
中文网:
注:
博客:
霸道流氓气质的博客_CSDN博客-C#,架构之路,SpringBoot领域博主
实现
1、安装turf
npm install @turf/turf
2、页面引入
import * as turf from '@turf/turf'3、使用示例
计算点到线段的最短距离
         var pt = turf.point([0, 0]);
         var line = turf.lineString(e.layer.toGeoJSON().geometry.coordinates);
         var distance = turf.pointToLineDistance(pt, line, {units: 'miles'});
参数说明

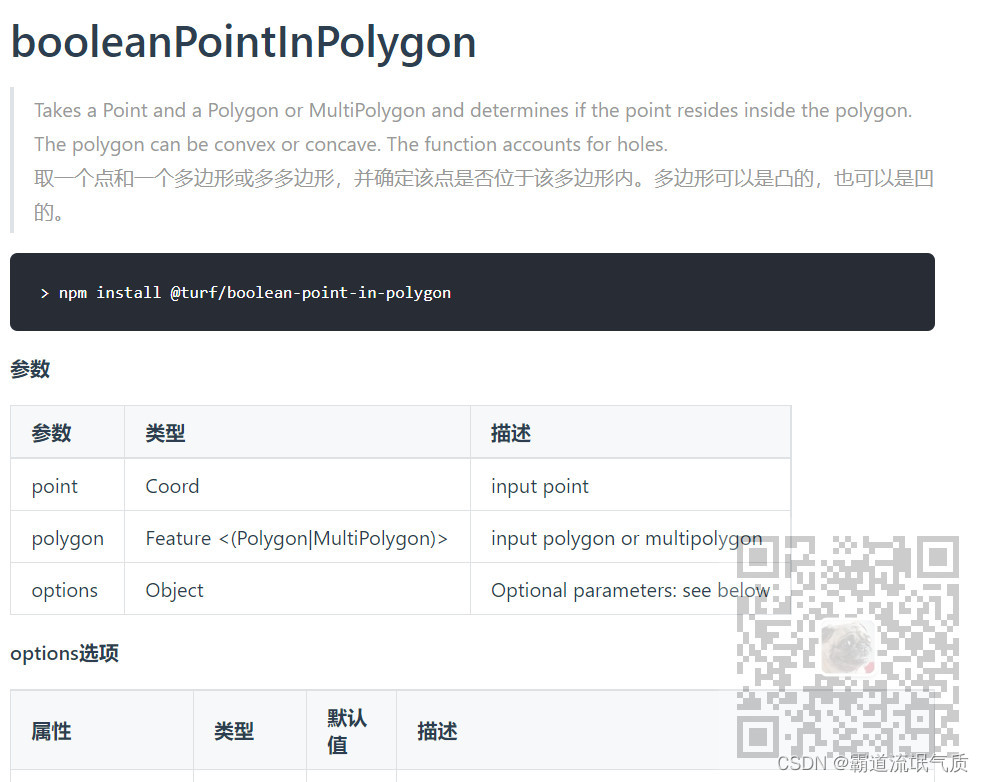
判断点是否在多边形内
        var point = turf.point([-118.182003,34.04896]);
        var polygon = turf.polygon(e.layer.toGeoJSON().geometry.coordinates);
        var isInPolygon = turf.booleanPointInPolygon(point,polygon);
参数说明
4、其他方法具体使用参考官网
这里结合leaflet以及pm插件绘制事件之后做一个使用demo,具体可参考前文
Vue+Leaflet.PM插件实现创建和编辑几何图形(点、线、面、圆等):
Vue+Leaflet.PM插件实现创建和编辑几何图形(点、线、面、圆等)_霸道流氓气质的博客-CSDN博客
完整示例代码
<template>
<div id="map" class="map"></div>
</template>
<script>
import "leaflet/dist/leaflet.css";
import L from "leaflet";
import "leaflet.pm";
import "leaflet.pm/dist/leaflet.pm.css";
import * as turf from "@turf/turf";
export default {
name: "leafletWithTurf",
data() {
return {
map: null,
OSMUrl: "https://{s}.tile.openstreetmap.org/{z}/{x}/{y}.png",
};
},
mounted() {
this.initMap();
},
methods: {
initMap() {
this.map = L.map("map");
this.map.setView([34.03, -118.15], 13);
let tileLayer = L.tileLayer(this.OSMUrl);
tileLayer.addTo(this.map);
// 添加绘制工具
this.map.pm.setLang("zh");
this.map.pm.addControls({
position: "topleft",
drawPolygon: true, //绘制多边形
drawMarker: false, //绘制标记点
drawCircleMarker: false, //绘制圆形标记
drawPolyline: true, //绘制线条
drawRectangle: false, //绘制矩形
drawCircle: true, //绘制圆圈
editMode: true, //编辑多边形
dragMode: true, //拖动多边形
cutPolygon: true, //添加⼀个按钮以删除多边形⾥⾯的部分内容
removalMode: true, //清除多边形
});
// 全局设置绘制样式
this.map.pm.setPathOptions({
color: "orange",
fillColor: "green",
fillOpacity: 0.4,
});
// 或者单独设置绘制样式
var options = {
// 连接线标记之间的线
templineStyle: {
color: "red",
},
// 提⽰线从最后⼀个标记到⿏标光标的线
hintlineStyle: {
color: "red",
dashArray: [5, 5],
},
// 绘制完成的样式
pathOptions: {
color: "orange",
fillColor: "green",
},
};
// 激活绘制多边形功能-1、单独设置某个模式的样式
this.map.pm.enableDraw("Polygon", options);
// 启用绘制--多边形功能
this.map.pm.enableDraw("Polygon", {
snappable: true, //启⽤捕捉到其他绘制图形的顶点
snapDistance: 20, //顶点捕捉距离
});
this.map.on("pm:create", (e) => {
debugger;
//计算点到多线段的最短距离
// var pt = turf.point([0, 0]);
// var line = turf.lineString(e.layer.toGeoJSON().geometry.coordinates);
// var distance = turf.pointToLineDistance(pt, line, {units: 'miles'});
//判断点是否在多边形内
var point = turf.point([-118.182003, 34.04896]);
var polygon = turf.polygon(e.layer.toGeoJSON().geometry.coordinates);
var isInPolygon = turf.booleanPointInPolygon(point, polygon);
});
},
},
};
</script>
<style scoped>
.map {
width: 100%;
height: 400px;
}
</style>
版权声明:本文内容由互联网用户自发贡献,该文观点仅代表作者本人。本站仅提供信息存储空间服务,不拥有所有权,不承担相关法律责任。如发现本站有涉嫌侵权/违法违规的内容, 请发送邮件至 举报,一经查实,本站将立刻删除。
文章由极客之音整理,本文链接:https://www.bmabk.com/index.php/post/135913.html

