
Pyinstrument 是一个 Python 分析器。分析器是一种帮助您优化代码的工具 – 使其更快。要获得最大的速度提升。
pyinstrument是一款python性能分析器,它通过记录程序执行过程中的堆栈记录来帮你找出程序最耗时的代码。pyinstrument每1毫秒中断一次程序,并在那一点记录整个堆栈,单个函数的执行时长会在函数执行结束后被记录。当你的python程序性能需要优化时,可以考虑使用pyinstrument来定位程序慢在哪里。
Pyinstrument 每隔 1ms 中断一次程序,并记录此时的整个堆栈。它使用 C 扩展和 执行此操作。
Pyinstrument 官方文档:Home – pyinstrument 4.4.0 documentation
Pyinstrument还支持flask、异步代码等的性能分析,具体可以查看官方文档进行学习。
Pyinstrument也提供了丰富的api供我们使用,官网文档有详细的介绍。
1、安装
pip install pyinstrument
2、案例分析
2.1 单条代码性能测试
示例代码:
from pyinstrument import Profiler

profiler = Profiler()
profiler.start()
# 生成长度为一千万的列表
b = [i for i in range(10000000)]
profiler.stop()
profiler.print()
运行结果:
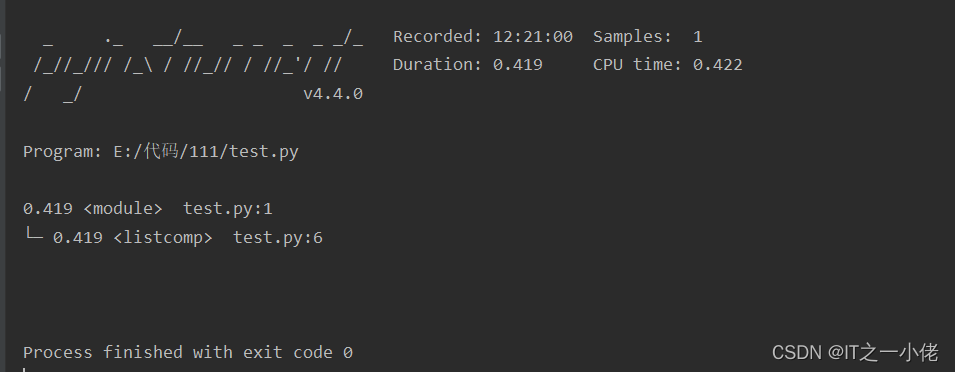
打印的信息包含了记录时间、线程数、总耗时、单行代码耗时、CPU执行时间等信息。
注意:如果码执行时间不到 1 毫秒时,需要设置一个小于默认值0.001(1毫秒)的时间间隔:
profiler = Profiler(interval=0.0001)2.2 多条代码性能测试
示例代码:
from pyinstrument import Profiler

profiler = Profiler()
profiler.start()
a = [i for i in range(10000000)]  # 生成长度为一千万的列表
b = [i for i in range(100000000)]  # 生成长度为一亿的列表
c = [i for i in range(200000000)]  # 生成长度为十亿的列表
profiler.stop()
profiler.print()
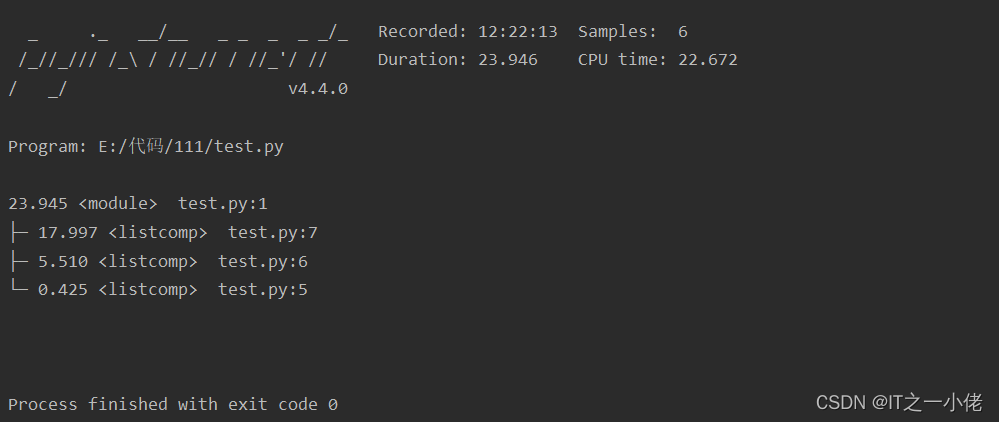
运行结果:
2.3 函数性能测试
示例代码:
import requests
from pyinstrument import Profiler


def test_api():
    url = 'http://www.baidu.com'
    res = requests.get(url)
    print(res.status_code)


profiler = Profiler()
profiler.start()

test_api()

profiler.stop()
print(profiler.output_text(unicode=True, color=True))
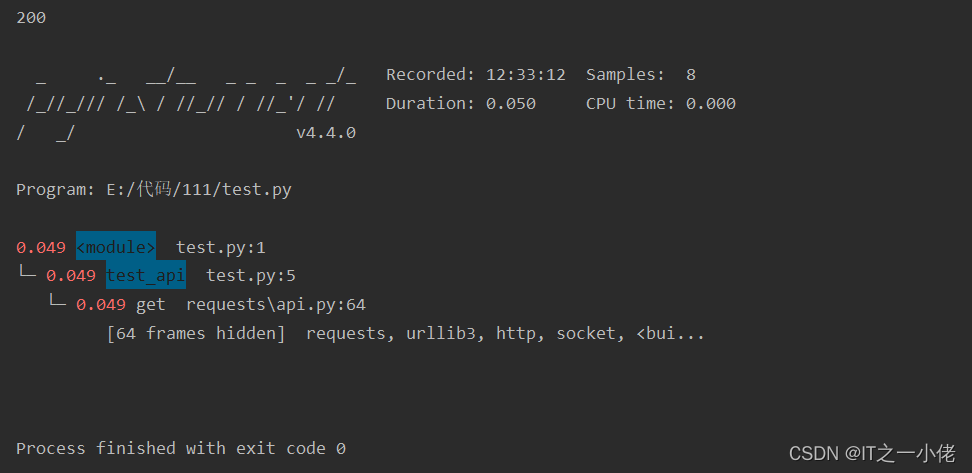
运行结果:
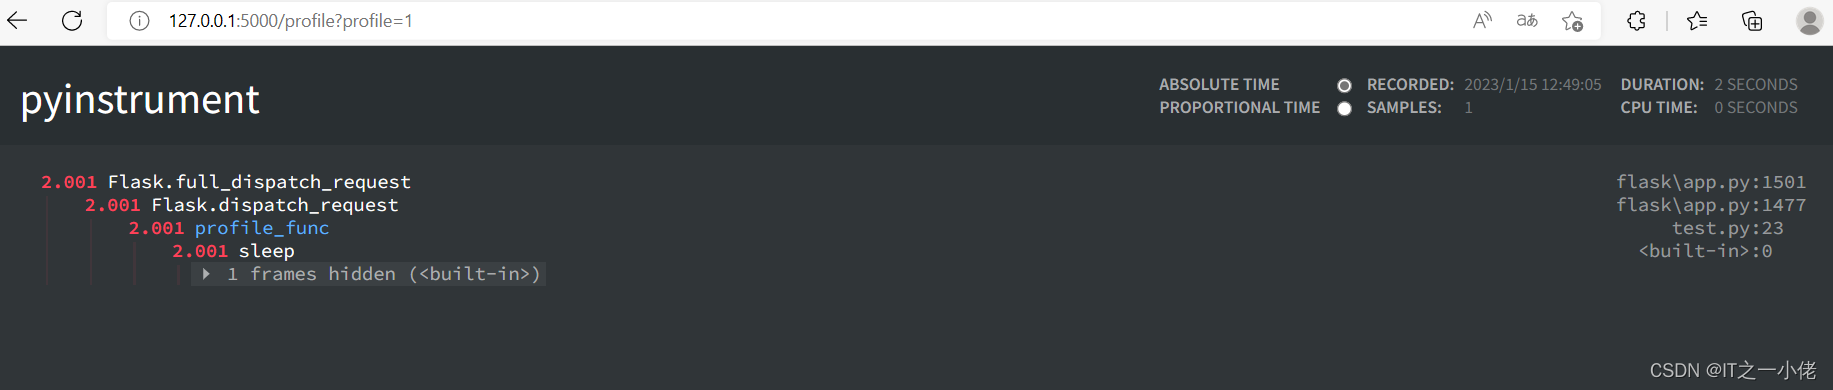
2.4 在Flask框架中使用
一个简单的设置来分析 Flask 应用程序如下。
示例代码:
from flask import Flask, g, make_response, request
from pyinstrument import Profiler

app = Flask(__name__)


@app.before_request
def before_request():
    if "profile" in request.args:
        g.profiler = Profiler()
        g.profiler.start()


@app.after_request
def after_request(response):
    if not hasattr(g, "profiler"):
        return response
    g.profiler.stop()
    output_html = g.profiler.output_html()
    return make_response(output_html)


@app.route('/profile')
def profile_func():
    profile = request.args.get('profile')
    import time
    time.sleep(2)
    return profile


if __name__ == '__main__':
    app.run()
运行结果:
3、Pyinstrument性能分析
Pyinstrument 是一个统计分析器 – 它不会跟踪您的程序进行的每个函数调用。相反,它每 1 毫秒记录一次调用堆栈。
与其他剖析器相比,这具有一些优势。首先,统计分析器的开销比跟踪分析器低得多。
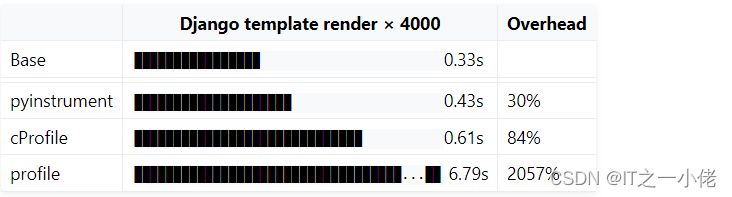
但低开销也很重要,因为它会扭曲结果。使用跟踪分析器时,进行大量 Python 函数调用的代码会大量调用分析器,从而使其变慢。这会扭曲结果,并可能导致您优化程序的错误部分!
版权声明:本文内容由互联网用户自发贡献,该文观点仅代表作者本人。本站仅提供信息存储空间服务,不拥有所有权,不承担相关法律责任。如发现本站有涉嫌侵权/违法违规的内容, 请发送邮件至 举报,一经查实,本站将立刻删除。
文章由极客之音整理,本文链接:https://www.bmabk.com/index.php/post/142807.html

![[Python] 协程学习过程](https://www.bmabk.com/wp-content/uploads/2022/05/post-loading-480x300.gif)